Tower of Hanoi – Reinforcement Learning

I think you are familiar with the old puzzle of Tower of Hanoi, if not then you can read about it in wikipedia and you can actually play it here. So long story short, it was invented in the year 1883 and it consists of 3 rods and a number of sequentially-sized disks allocated on the leftmost rod, and the objective is to move all the disks from the leftmost rod to the rightmost one with the least possible number of moves. Two important rules you have to follow are that you can only move one disk at a time, and also you can’t move a bigger disk on top of a smaller one i.e. in any rod, the order of disks must always be from the largest disk at the bottom to the smallest disk at the top as depicted in this picture.

Towers Of Hanoi

There are many algorithms used to solve the Tower of Hanoi puzzle but since puzzles/games have extremely efficient demonstration capabilities of machine learning techniques due to their immediate visual effect and (usually) clear logical workflow, in this post, I present how to take advantage of reinforcement learning techniques to let your program explores and solves Tower of Hanoi puzzle and finally, providing the shortest possible path to the final (winning) state. Tower of Hanoi puzzle solution is considered a deterministic Markov Decision Process.

I will demonstrate the example with 3 disks, but the algorithm is dynamic and can take up to as many disks as you want but you have to take into account the processing power and computational complexity of high number of disks.

I quote from Wikipedia:

The puzzle was invented by the FrenchmathematicianÉdouard Lucas in 1883. There is a story about an Indian temple in Kashi Vishwanath which contains a large room with three time-worn posts in it surrounded by 64 golden disks. Brahmin priests, acting out the command of an ancient prophecy, have been moving these disks, in accordance with the immutable rules of the Brahma, since that time. The puzzle is therefore also known as the Tower of Brahma puzzle. According to the legend, when the last move of the puzzle will be completed, the world will end.[2] It is not clear whether Lucas invented this legend or was inspired by it.

If the legend were true, and if the priests were able to move disks at a rate of one per second, using the smallest number of moves, it would take them 264−1 seconds or roughly 585 billion years[3] or 18,446,744,073,709,551,615 turns to finish, or about 127 times the current age of the sun.

So even if the implemented algorithm is highly optimized, it is totally normal for Tower of Hanoi to take considerably long time for calculating the optimal shortest path.

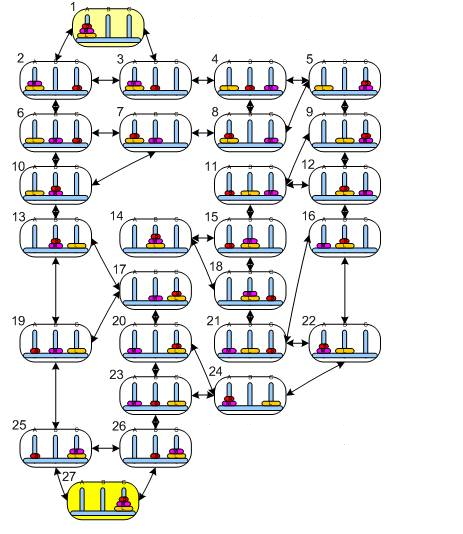
Here is all the possible states of Tower of Hanoi with three disks:

tower-of-hanoi-all-possible-states

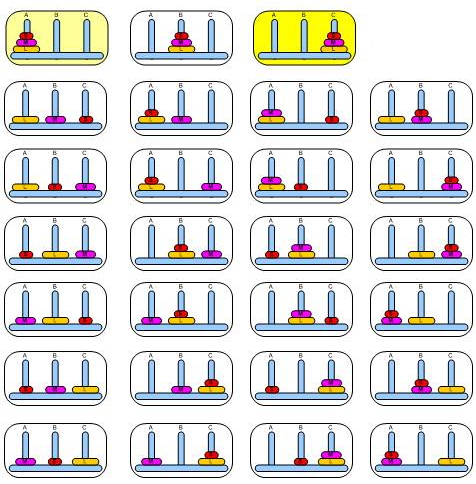
The total number of all possible states in Tower of Hanoi puzzle is 3 raised to power of the number of disks.

number-of-possible-states

where:

states-count   is the number of elements in the set States, and

n       is the number of disks

So in our example we have (3 x 3 x 3 = 27) unique possible states of the distribution of disks over the three rods including empty rods but two empty rods can be in a state at max. Here is all the actions possible to move from one state to another.

tower-of-hanoi-states-actions

The least possible number of moves for this puzzle is:

lowest-possible-moves

where n is the number of disks.

So for a puzzle with 3 disks, the least possible moves count is 7, let’s see if this is achieved in my algorithm below.

I’ve implemented the reinforcement learning algorithm in C# and you can find the full solution files here. I’ve even made it through object-oriented design, here is the classes:

Program: main entry point of the program.

TowerOfHanoi: Defines the basic structure of the game, actually we have only one variable which is the number of disks whereas the number of rods is always three.

StateGenerator: As the name suggests, this class generates the next possible states for an input state, and can be used recursively to generate all the possible states of Tower Of Hanoi with any number of disks. This class has the following public methods:

  • GenerateStates: it is used to generate all possible states using a private recursive method GetNextStates
  • StateActionMapping: it is used to fill R matrix with the possible actions for each state. It makes use of the non-recursive version of the method GetNextStates to retrieve the direct next steps.

QLearning: Carries the actual implementation of the Q-Learning algorithm which is in short:

Q-Learning is a model-free reinforcement learning technique. Specifically, Q-learning can be used to find an optimal action-selection policy for any given (finite) Markov decision process (MDP).

In Q-Learning algorithm, we have the following variables to use:

  • Q Matrix: a 2D array which, at first, populated with a fixed value for all elements (usually 0). It is used to hold the calculated policy overall states i.e. for every state, holds the rewards for the respective possible actions.
  • R Matrix: a 2D array which hold the initial rewards, and also I use it to allow the program to determine the list of possible actions for a specific state.
  • Discount Factor: Determines the policy of the agent in how it looks to rewards. A discount factor close to 0 will make the agent greedy by only considering current rewards, while a discount factor approaching 1 will make it more strategic and far-sighted for better reward on the long run.

This class has the following methods:

  • Constructor: sets some variables.
  • Init: calls for generation of all possible states and for the start of the learning process.
  • Learn: has the sequential steps for the learning process.
  • InitRMatrix: Initializes the Reward matrix and in my implementation of the algorithm, the elements of R could take one of these values:
    • 0: It means that we do NOT have information about the reward when taking this action in this state.
    • -1: It means that there is no way to take this action in this state.
    • 100: It means this is our big reward in the final state where we want to go.
  • InitQMatrix: Basically sets all Q elements to 0.0
  • TrainQMatrix: Contains the actual iterative value update rule of the Q matrix, and when it finishes execution we expect to have a “trained” agent.
  • NormalizeQMatrix: Normalizes the values of the Q matrix making them percentages.
  • Test: Provides textual input from the user and printing the optimal shortest path to solve the puzzle.

Utility: a utility class for math functions.

Q Learning Algorithm:

This is the iterative value update rule

q-learning-iterative-value

and here is the code for the method TrainQMatrix which includes the Q Learning algorithm logic:

private void TrainQMatrix(int _StatesMaxCount)
{
    // list of available actions (will be based on R matrix which
    // contains the allowed next actions starting from some state as 0 values in the array)
    List<int> nextActions = new List<int>();
    int nextStep = -1;

    int counter = 0;
    int init = -1;

    int rIndex = 0;

    // _StatesMaxCount is the number of all possible states of a puzzle
    // from my experience with this application, 3 times the number
    // of all possible moves has enough episodes to train Q matrix
    while (counter < 3 * _StatesMaxCount)
    {
        init = Utility.GetRandomNumber(0, _StatesMaxCount);

        do
        {
            // get available actions
            nextActions = GetNextActions(_StatesMaxCount, init);

            // Choose any action out of the available actions randomly
            nextStep = Utility.GetRandomNumber(0, nextActions.Count);
            nextStep = nextActions[nextStep];

            // get available actions
            nextActions = GetNextActions(_StatesMaxCount, nextStep);

            // set the index of the action to take from this state
            for (int i = 0; i < 3; i++)
            {
                if (R[init, i, 1] == nextStep)
                    rIndex = i;
            }

            // this is the value iteration update rule
            // discount factor is 0.8
            Q[init, nextStep] = R[init, rIndex, 0] + 0.8 * Utility.GetMax(Q, nextStep, nextActions);

            // set the next step as the current step
            init = nextStep;
        } while (init != FinalStateIndex);

        counter++;
    }
 }

The code is explained with comments, if you still need help, drop a comment below.

Keep in your mind that not training the Q matrix enough could result in the algorithm taking non-optimal paths even if it gets to the final state.

Demo

Here is a demonstration for the algorithm solving the puzzle with 3 disks. Yes I know it is on console but it can be easily linked to UI elements (Windows, web…etc.) later.

Tower of Hanoi Demo (3 Disks) - Q Learning

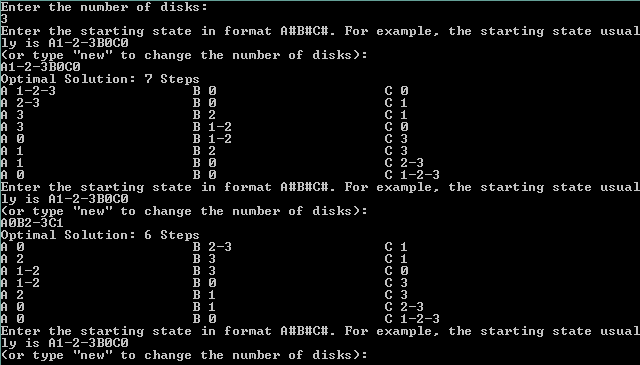
Tower of Hanoi Demo (3 Disks) – Reinforcement Learning

The starting state for the puzzle with 3 disks is “A1-2-3B0C0” which means that all the disks are in the leftmost rod (A) and both of (B) and (C) are empty. You can see that from the starting state, it took the algorithm 7 moves to get to the final state.

Here is another demonstration for the puzzle with 4 disks

Tower of Hanoi Demo (4 Disks) - Q Learning

Tower of Hanoi Demo (4 Disks) – Reinforcement Learning

The least possible moves count here is 15 which, again, complies with our Least Possible Moves equation above.

I hope you learned something new from this post, please share it on Facebook, Twitter or your favorite social network. As usual, your comments, inquires or corrections are always welcome.

Pivot Transformation in SSIS 2012 – Part 5 of 5

This article has been divided to five parts:

Part 1 – Getting data from flat file (Extract).

Part 2 – Sorting data (Transform).

Part 3 – Pivoting data (Transform).

Part 4 – Loading data to an SQL Server database table (Load).

Part 5 – Finalizing and Executing SSIS Package  – you are here

Abstract

Although, I found many ETL tutorials on the web which include Pivot transformations in SSIS, some of them were done using older versions of SSIS so they are out-of-date and others were not clear enough. That’s why I decided to create and share my own tutorial with detailed instruction on how to create ETL processes with Pivot transformation in SQL Server Integration Services 2012 (SSIS 2012).

Part 5

Step 18

The package is ready to be executed but before you execute it, we need to add an Execute SQL Task to delete the contents of table “Aviation_Pivoted” every time you execute the package, otherwise, you would end up with duplicate data. Navigate to “Control Flow” tab and add an Execute SQL Task.

Control Flow - Execute SQL Task, Data Flow Task

Then double-click it to open Execute SQL Task Editor, choose “OLE_Aviation” in the connection property.

Execute SQL Task Editor

Step 19

Click the small button in SQLStatement property, the SQL Editor will open:

SQL Query Editor

Type the SQL Statement


TRUNCATE TABLE dbo.Aviation_Pivoted;

Rename the recently created Execute SQL Task to “SQL_ResetAviation” by changing its name property.

Step 20

Drag the green arrow from “SQL_ResetAviation” to “DFT_Aviation”.

Control Flow - Execute SQL Task, Data Flow Task

Step 21

Right-click the package in Solution Explorer, and click on “Execute Package”.

Solution Explorer - Execute Package

A successful execution will look like this:

Package Executed Successfully

Notice the number of rows moving from every task to the next, this is amazingly helpful in diagnosing what is going on in case you get an error.

Step 22

Go to SSMS, open a new SQL Editor and type or copy this Select statement:

SELECT * FROM dbo.Aviation_Pivoted;

Here is the final result, as promised:

Data After Pivot

Of course, we could have a different order of the columns. Although SQL Server deals with table rows as a set of elements with no order whatsoever, it does have a defined ordering of the columns and it follows the order as presented in the CREATE TABLE statement.

Conclusion

I personally think of Pivot transformation in SSIS as a way to transpose a part of the data at hand, and although a Pivot operation should be more powerful than this – and actually it is in other platforms such as MS Excel Pivot Table, SQL Server’s T-SQL, Oracle and Python – it is still a vital option in SSIS. The reason behind the weakness of Pivot transformation in SSIS is that it is unable to aggregate values, which means you can’t sum, count or average the values of the Pivot Value column which here represents the monthly count of flights (I know the numbers are unrealistic, but I chose small numbers to ease the process when you try to follow a value and where it ended in the new pivoted data). If you were working in a marketing analytics department in some Air Flight company, an answer to a question like “What is the seasonality of our aviation flights over the years 2010-2015 for classes A, B and C of our customers?” will need to pivot and aggregate (average, to be more specific) the counts of aviation flights over the months data of the years 2010-2015 for classes A, B and C of customers and detect the pattern of seasonality, this unfortunately cannot be done with the current version of SSIS, but you can always depend on other platforms such as T-SQL or Excel to achieve such tasks.

I hope you reached to this point and learned something new today, if you got any inquiry, post a comment below and I will try my best to help you.

Pivot Transformation in SSIS 2012 – Part 4 of 5

This article has been divided to five parts:

Part 1 – Getting data from flat file (Extract).

Part 2 – Sorting data (Transform).

Part 3 – Pivoting data (Transform).

Part 4 – Loading data to an SQL Server database table (Load) – you are here

Part 5 – Finalizing and Executing SSIS Package.

Abstract

Although, I found many ETL tutorials on the web which include Pivot transformations in SSIS, some of them were done using older versions of SSIS so they are out-of-date and others were not clear enough. That’s why I decided to create and share my own tutorial with detailed instruction on how to create ETL processes with Pivot transformation in SQL Server Integration Services 2012 (SSIS 2012).

Part 4

Step 12

Go to SQL Server Management Studio, and add a new database, name it “Aviation”.

SQL Server Management Studio - New Database

Step 13

Add a new OLE DB Connection from the Connection Managers pane, we need to connect to a suitable SQL Server database, we will use it to load the transformed (pivoted) data to a new table in it, if a suitable database is listed on the list box on the left, select it and click OK.

OLE DB Connection Manger

Otherwise, click “New…” to create a new connection to SQL Server, select your preferred SQL Server instance from the drop-down list, provide your own SQL Server Authentication or go with Windows Authentication, then select the database you created in the previous step. You may want to test the connection to make sure it is successful. Then click OK, you will be back to the Configure OLE DB Connection Manager with your new connection selected, click OK.

OLE DB Connection Manager - Configuration

Then rename the new connection manager to “OLE_Aviation”. You should have two connection managers now:

Connection Managers Pane

Step 14

Now go back to Visual Studio, add a Destination Assistant from SSIS Toolbox, and when the “Add New Destination” dialog pops up, select SQL Server from “Select destination type” and OLE_Aviation from “Select connection managers”, rename the newly created Destination Assistant to “DST_OLE_Aviation”.

Destination Assistant - Add New Destination

Step 15

Drag the blue arrow from “PVT_Aviation” to “DST_OLE_Aviation”.

Data Flow - Source Assistant, Sort, Pivot, Destination Assistant

Step 16

Double-click “DST_OLE_Aviation”, notice the warning below says “Select a table or view from the list.”

OLE DB Destination Editor

So let’s do that, click the drop-down list under “Name of the table or the view” and Oops, It is empty! Well that makes sense because we just created the database Aviation and it is still empty, but SSIS is here for the rescue…

Instead of us going to SSMS and created a new table, you can click on “New…” only to find the code of your table lingering there and ready to be executed, notice that SSIS recognized the names and data types of the input to your Destination Assistant and gave us a ready Create Table statement but well hold on a second, it is a good idea that we change the table name before we click OK, so change it to “Aviation_Pivoted” and click OK. Now if you check in SSMS, the table has been actually created in database Aviation but it is still empty.

Create Table

Step 17

Navigate to Mappings, and the columns between the input and destination will be mapped automatically based on their names, click OK.

OLE DB Destination Editor - Mappings

In other scenarios, you might be face with different names, so then you need to map them manually yourself.

Now your Data Flow designer should look like this:

Data Flow - Source Assistant, Sort, Pivot, Destination Assistant

Continue to the next part of this article – Finalizing and Executing SSIS Package.

Pivot Transformation in SSIS 2012 – Part 3 of 5

This article has been divided to five parts:

Part 1 – Getting data from flat file (Extract).

Part 2 – Sorting data (Transform).

Part 3 – Pivoting data (Transform) – you are here

Part 4 – Loading data to an SQL Server database table (Load).

Part 5 – Finalizing and Executing SSIS Package.

Abstract

Although, I found many ETL tutorials on the web which include Pivot transformations in SSIS, some of them were done using older versions of SSIS so they are out-of-date and others were not clear enough. That’s why I decided to create and share my own tutorial with detailed instruction on how to create ETL processes with Pivot transformation in SQL Server Integration Services 2012 (SSIS 2012).

Part 3

Step 9

Add a Pivot transformation from SSIS Toolbox, rename it to “PVT_Aviation” and drag the blue arrow from “SRT_AviationByStage” to “PVT_Aviation”, your Data Flow designer must look like this:

Data Flow - Source Assistant, Sort, Pivot

Step 10

Double-click the PVT_Aviation transformation to edit its properties, the dialog box you see is the most important part of this article, as it has these 3 drop-down lists:

  • Pivot Key: This is the column that you want to use it to create new columns based on this column’s values. In our example, we will use the month in the EventMonth to create new columns from its values (1, 2, 3, 9, 10, 12), so select “EventMonth” from the drop-down list.
  • Set Key: Notice the word “Set”, due to strong relationship between mathematics and relational model, the word Set in Data Science, means a unique group of elements with no specific order. This is the row which will be unique in your pivoted data, and it MUST be sorted before it gets to the Pivot transformation. In our example, every state of the State column in the original data, must be represented by one and only one row in your pivoted data, so select “State” from the drop-down list.
  • Pivot Value: This will hold values of the mapping of the columns and rows above. In our example, we will set this to the TotalMajorInjuries column, so do that.

Pivot Transformation Editor (Initial)

That’s for the upper part, whereas the lower part, has the checkbox “Ignore un-matched Pivot Key value and report them after DataFlow execution”, this is to tell SSIS to ignore the values of the column you specified in Pivot Key above (EventMonth) if you haven’t created suitable columns for any of them in the new pivoted data.

The rest of controls are there to help you generate the expected new columns. In the multiline textbox on the left, SSIS expects you to provide a comma-separated list of values that you want to create columns for. In our case here we know the values that we want to generate columns for, they are the unique values of the EventMonth column “1,2,3,9,10,12” so copy what is inside these double quotations and paste it in that field, then press the button “Generate Columns Now”, you will see a list of columns in the list box on the right, the names of the columns have the format “C_{value}_PivotValue” and since we have 6 values, 6 new columns will be generated. The dialog should look like this now:

Pivot Transformation Editor (Configured)

Click OK.

Step 11

The names of the columns generated in the previous step are ugly and meaningless and since we know that we are pivot-ing against the value of Major Injuries, we don’t want to show “MajorInjuries” in each and every column header of the columns which are supposed to represent months. So let’s rename them… right-click on “PVT_Aviation” and select “Show Advanced Editor…” then navigate to “Input and Output Properties” tab and there drill down the groups “Pivot Default Output” and then “Output Columns”, this is the full list that the Pivot transformation will deliver to the outer world, select the ones starting with “C_…” and change their name attribute, on the right, to the corresponding month, for example: “C_10_TotalMajorInjuries” to “October” and “C_12_TotalMajorInjuries” to “December” and so on…

The columns must be like this if you’ve done it right:

Pivot Advanced Editor - Output Column Names

Click OK.

Continue to the next part of this article – Loading data to an SQL Server database table (Load).

Pivot Transformation in SSIS 2012 – Part 2 of 5

This article has been divided to five parts:

Part 1 – Getting data from flat file (Extract).

Part 2 – Sorting data (Transform) – you are here

Part 3 – Pivoting data (Transform).

Part 4 – Loading data to an SQL Server database table (Load).

Part 5 – Finalizing and Executing SSIS Package.

Abstract

Although, I found many ETL tutorials on the web which include Pivot transformations in SSIS, some of them were done using older versions of SSIS so they are out-of-date and others were not clear enough. That’s why I decided to create and share my own tutorial with detailed instruction on how to create ETL processes with Pivot transformation in SQL Server Integration Services 2012 (SSIS 2012).

Part 2

Step 5

As you may know already, Pivot transformation in SSIS does not enforce the input data to be sorted but it does require that, which means it will not give you an error message, but if you dare to hand it unsorted data, you would get unexpected results. So let’s sort the data, add a Sort transformation from SSIS Toolbox, and give it a meaningful name such as “SRT_AviationByState”.

Step 6

Drag the blue arrow from “FF_SRC_Aviation” to “SRT_AviationByState”, your Data Flow designer now should look like this:

Data Flow - Source Assistant, Sort

Can you see the red X on our Sort transformation? This is trying to tell you that something is wrong with this task, if you hover over it, you can get a description of the error or misconfigured options but do not worry; we will deal with it soon.

Step 7

Double-click “SRT_AviationByState”, you will see the list of the columns of our flat file, Sort transformation expects you to select at least one column to sort by, select the checkbox for State column, notice the row added in the grid below, it tells us by which column it will sort and also some other options such as Sort Type (ascending, descending). Make sure the checkbox “Remove rows with duplicate sort values” is not selected and click OK.

Sort Transformation Editor

This is when that dreadful red X will disappear as you can see in the screenshot below.

Data Flow - Source Assistance, Sort

Continue to the next part of this article – Pivoting data (Transform).